
Case study
Sentinela Verde · 2026
Sentinela Verde.
A simple way to see where Romania’s forests are disappearing.
A simple way to see where Romania’s forests are disappearing.
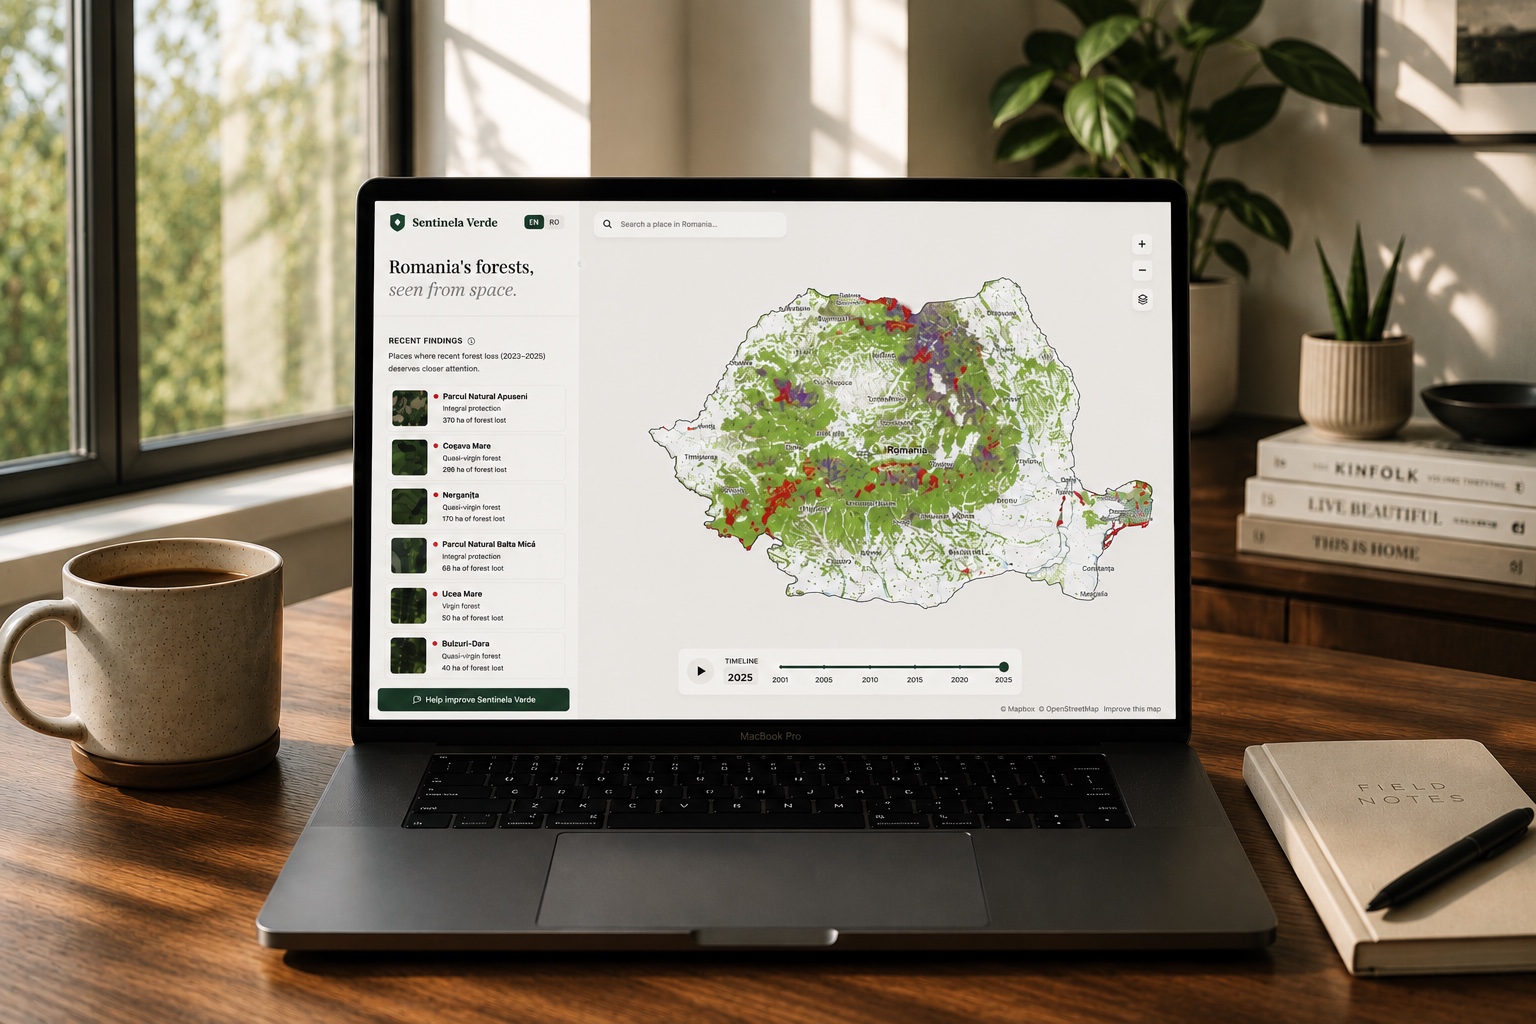
Overview
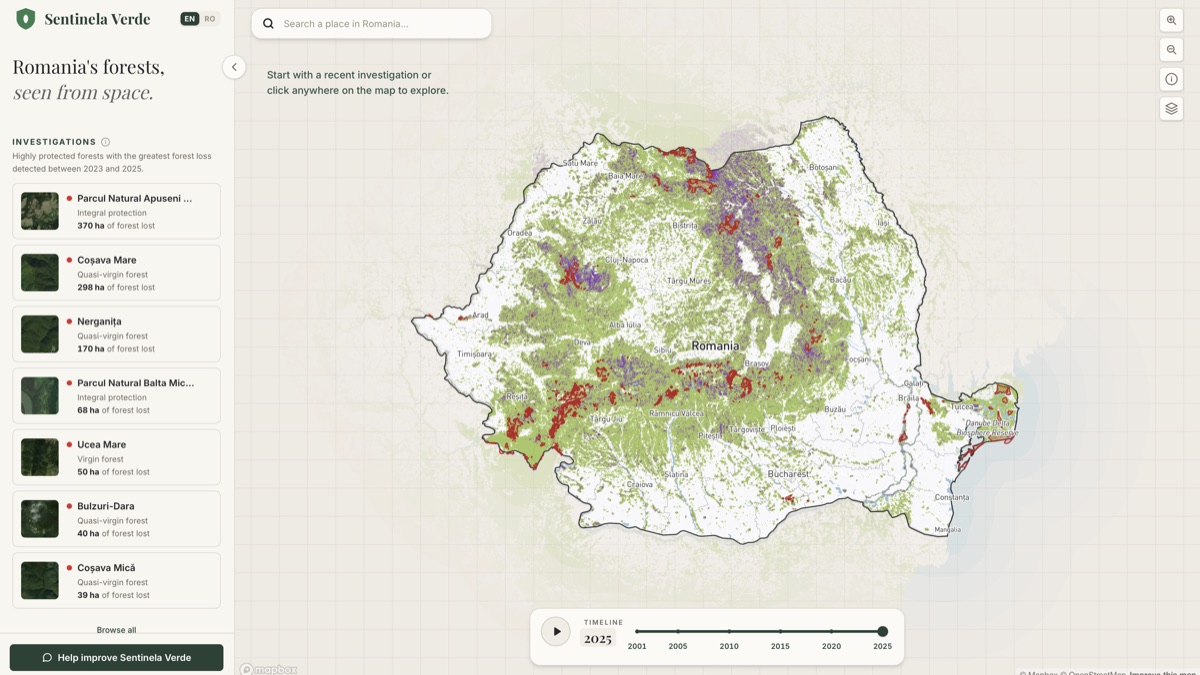
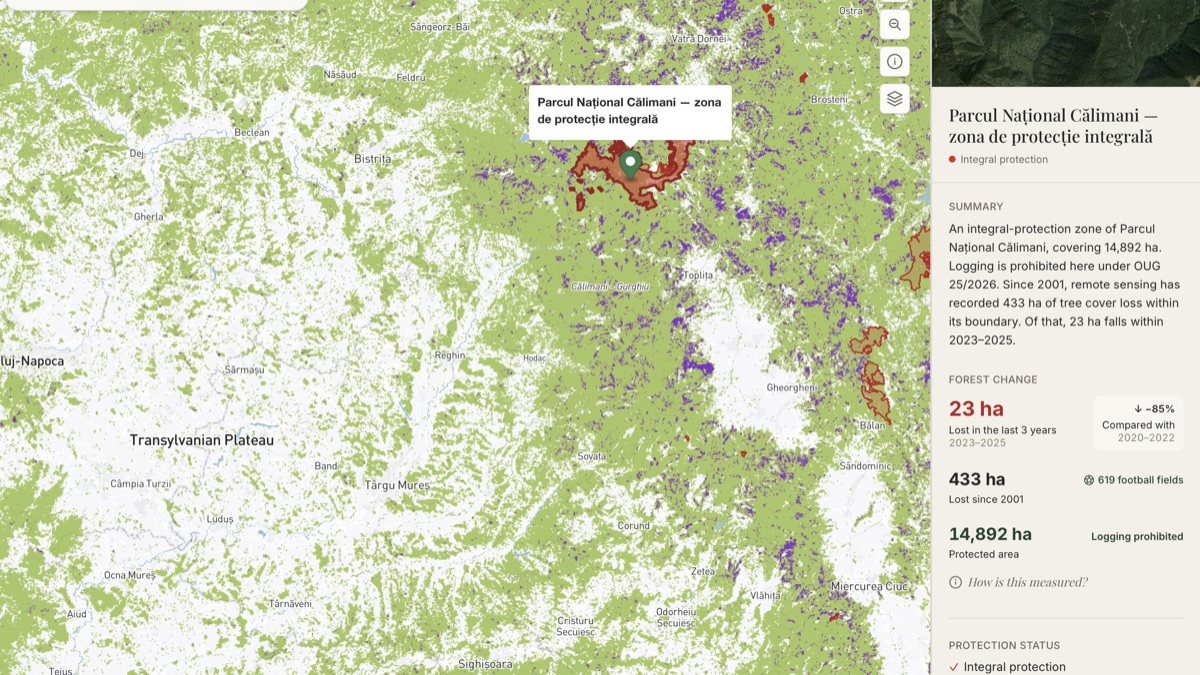
Sentinela Verde is an interactive map that makes forest loss in Romania easier to see and understand. It brings together satellite-based forest-loss data and protected-area information to show where forest loss overlaps with areas under different levels of environmental protection.
The problem
Romania is home to some of the EU’s largest remaining old-growth forests - around half a million hectares supporting bears, wolves and lynx.
Coming back to Romania made an environmental problem feel much more immediate.
After spending much of my adult life in the UK, I returned to Romania in 2026 and found myself paying much more attention to what was happening to the country’s forests, including the ongoing concern around illegal logging. I started looking for a simple way to understand what was happening, particularly in relation to protected areas and the different protections that apply to them. But I couldn’t find a tool that brought this information together in a way that was clear and intuitive for someone without specialist knowledge.
So I decided to build one.
I was looking for information about forest loss, protected areas, conservation designations and the protections that apply to them, and most importantly, where these things overlap.
The information existed, but it was spread across different datasets, government portals and specialist geographic tools. Each source answered part of the question, but none gave me the combined view I was looking for.
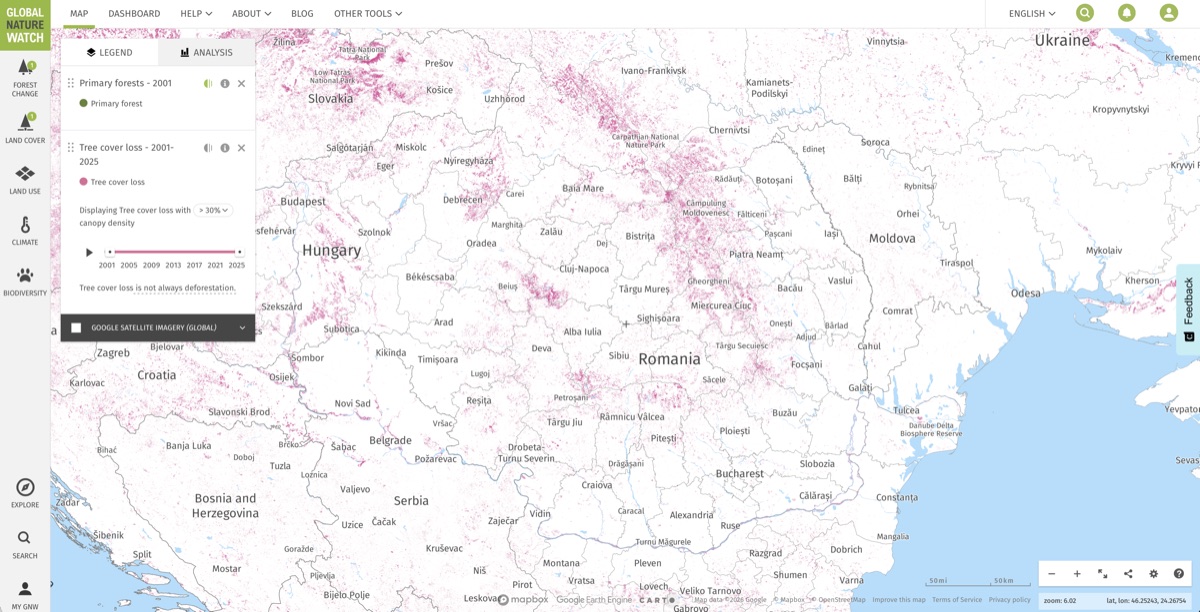
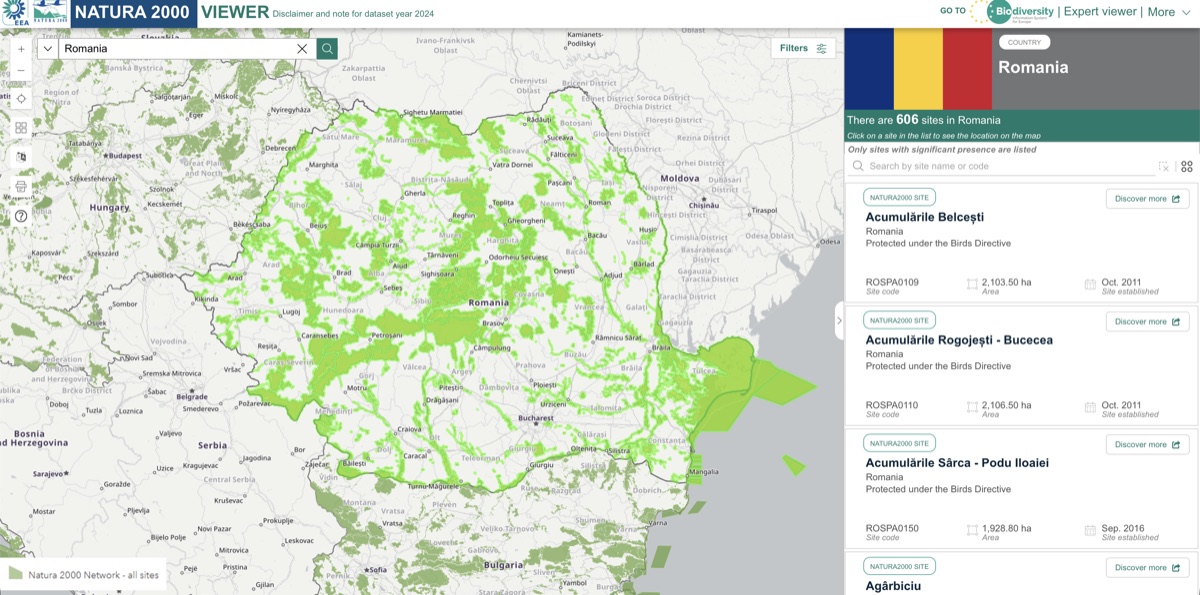
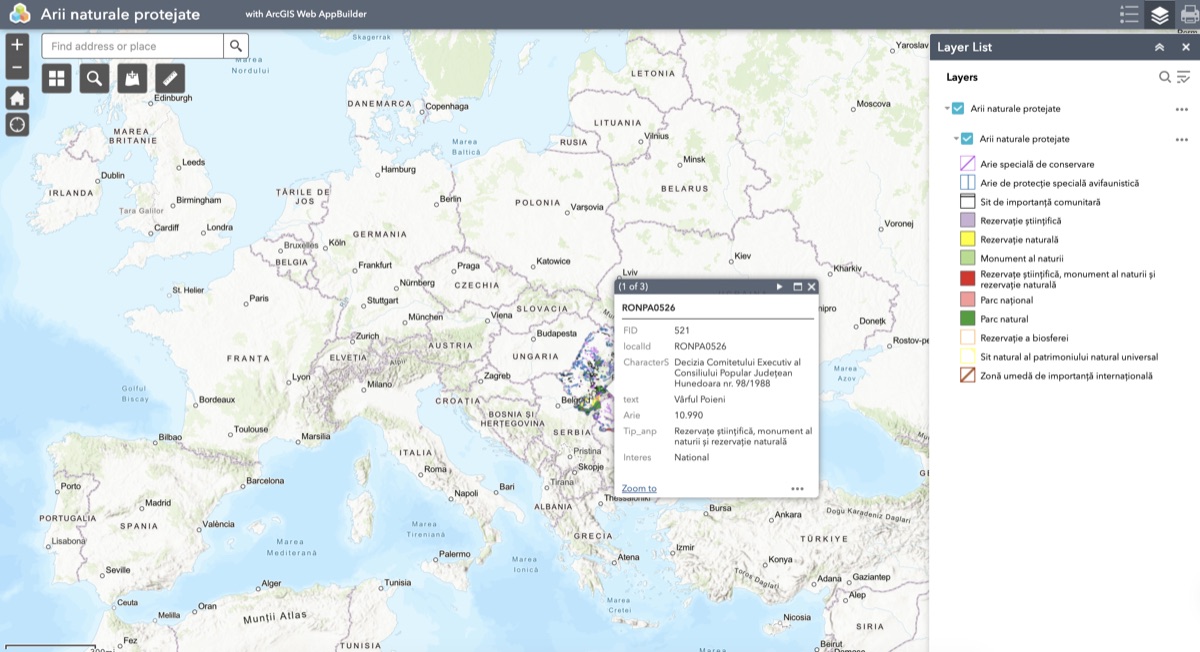
That led to the central design challenge:
How might I bring complex environmental data together and make it understandable to someone without specialist knowledge?
Understanding the data
Global Forest Watch / UMD tree-cover loss
Used for the visual forest-loss layer and location-level figures.
European Environment Agency / Natura 2000
Used to show protected sites and their conservation designations.
Romanian Ministry of Environment
Used for national-park internal zoning and virgin/quasi-virgin forest data.
I initially explored near-real-time disturbance alerts, but the alert dataset I tested did not provide the coverage or reliability I needed for Romania. For V1, I chose annual UMD tree-cover-loss data instead, giving the product a consistent historical series from 2001 onwards.
From datasets to questions
Initially, I considered exposing each dataset as a separate map layer. While technically accurate, this reflected the structure of the data rather than the way people actually think about the problem.
A non-specialist user is unlikely to ask:
“Show me the Virgin Forest dataset.”
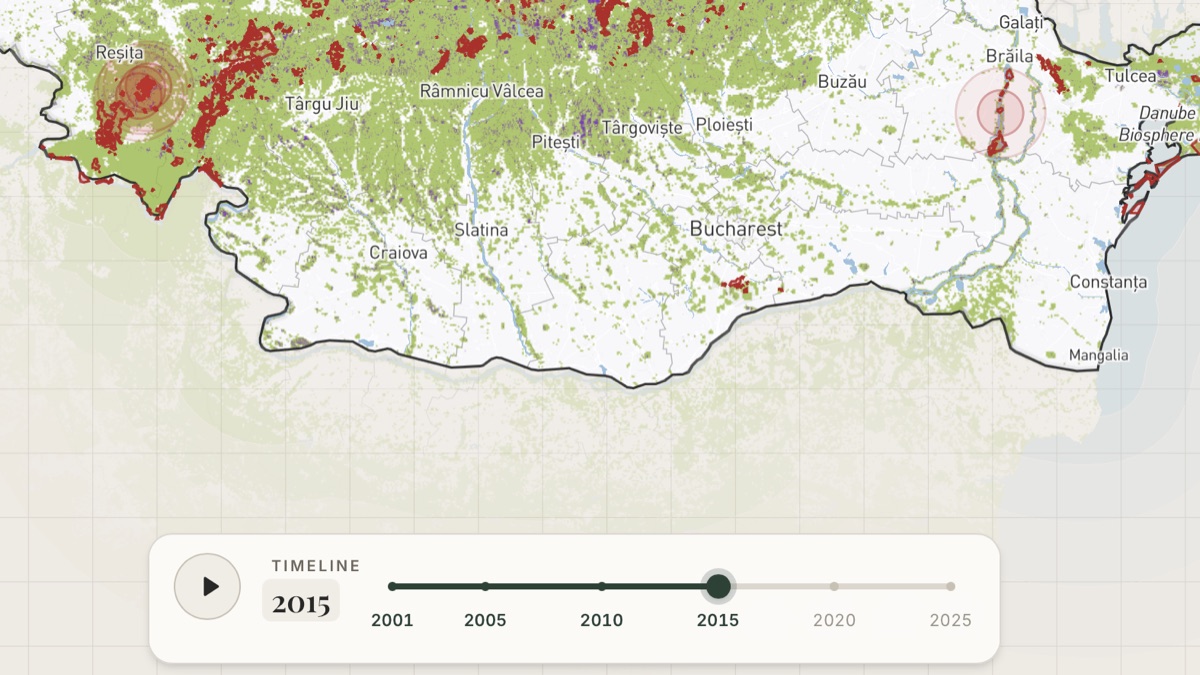
Forest loss detected from satellite data, year by year.
Which environmental protections and conservation designations apply to this location.
Whether forest loss has been detected in an area with stronger environmental protections.
These questions became the organising principle for the product.
Designing & building in code
I treated the map more like an investigative information graphic than a GIS dashboard.
Because the core experience is a live map rendering real environmental data, working directly in the browser let me make design decisions against real map density, edge cases and data behaviour as they emerged.
The design system is built into the codebase, with typography, colour, spacing, components and interaction patterns defined consistently across the product.
The result
What started as a search for a clearer way to connect fragmented environmental information became a live product - designed, built and launched in six weeks.
Sentinela Verde V1 is now live in Romanian and English.
What’s next
Add wildlife and biodiversity data, helping users understand how forest loss intersects with habitats and protected species.
Surface relevant news and public information for the selected area, so users can understand what may be happening on the ground, from reported logging activity and conservation efforts to local developments or environmental disputes.
Where reliable public information is available, provide contact info for the relevant local authority, giving users a potential route to raise concerns.